 Research Support Office, Okayama University of Science
Faculty of Management, Department of Management
- Lecturer
- Mika FUJIWARA
- Research Field
Data science
- Keyword(s)
Data visualization, Multivariate graphs, Data analysis
- Research theme
-
- Development of multivariate graphs and their evaluation.
- Analysis of purchasing behavior using multivariate graphs.
Outline of research activities

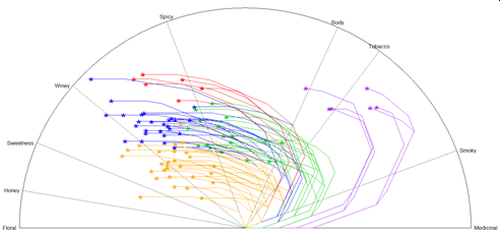
Graph representation methods are very useful for data analysis. Our research focuses on devising and developing new visualization methods to visually represent the characteristics of multivariate data and the characteristics of clusters.For example, we have proposed and developed expanded constellation graphs based on the concept of constellation graphs, and have examined its usefulness.
The figure below shows the flavor characteristics evaluated by applying the expanded constellation graph to the flavor data of Scotch whiskey. The graph shows that each cluster is clearly classified. In addition, the lines (paths) show the characteristics and trends of the data.
- Desired cooperation
-
- Research on data visualization using multivariate graphs.
- Data analysis.